Introduction:
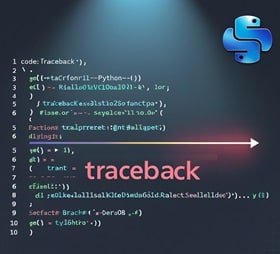
When writing Python code, errors are inevitable. Understanding where and why an error occurred is crucial for effective debugging. One of the most powerful tools for diagnosing issues is the traceback. In this blog post, we’ll explore what tracebacks are, why they are important, and how to use them effectively to debug your Python code.
Understanding Python Tracebacks for Debugging
A traceback is a detailed report generated by Python when an exception occurs during program execution. It reveals the sequence of function calls that led to the error. This includes essential information such as the file name, line number, and the type of exception raised.
When you’re debugging, tracebacks give you a clear view of where your code broke and why, making it an indispensable tool for developers.
Why Python Tracebacks for Debugging are Essential
Tracebacks provide valuable context that helps you pinpoint the origin of errors. They show you:
- The sequence of function calls leading to the error.
- Exact line numbers where the error occurred.
- Error types that help you understand the nature of the problem.
By using tracebacks effectively, you can speed up the debugging process and improve the quality of your code. They allow you to quickly identify where things went wrong, saving you time and frustration.
Components of a Traceback:
A typical traceback is divided into several key components:
- Traceback Header: This shows the most recent function call at the top of the traceback.
- Function Call Sequence: Below the header, the traceback lists each function call, starting from the main module and drilling down into deeper function calls.
- File and Line Number: Each function call includes the file name and line number where it occurred.
- Specific Error Message: At the end of the traceback, you’ll find the specific error message (e.g.,
ZeroDivisionError) that explains what went wrong.
Traceback (most recent call last):
File "example.py", line 3, in <module>
print(divide(5, 0))
File "example.py", line 2, in divide
return x / y
ZeroDivisionError: division by zeroExplanation:
- The error occurred on line 3 of your script (example.py).
- The attempt to divide by zero happened on line 2 in the
dividefunction.
How to Read a Traceback
Understanding how to read a traceback is essential for debugging. Follow these steps:
- Read from the Bottom Up: Tracebacks are structured in a bottom-up format. The most recent function call appears at the bottom, and you work your way up to trace the path.
- Identify the Error Type: The error type (e.g.,
ZeroDivisionError) is specified at the bottom of the traceback. This gives you a hint about the nature of the issue. - Locate the Faulty Code: The traceback includes the file name, line number, and function name, making it easy to locate the exact point where the error occurred.
Using the Traceback Module
The traceback module in Python allows you to format and print tracebacks in various ways. This is useful for logging errors or customizing error handling in your application.
You can explore more about how to use the traceback module in Python here.
For more complex errors, consider using a debugger. Debuggers let you step through your code line by line, inspecting variables and call stacks. This is especially useful for tricky issues that aren’t easily caught by tracebacks alone.
Additional Debugging Tools
In addition to tracebacks, other tools can help with debugging, such as:
- Python’s built-in
pdbdebugger. - Logging libraries for capturing detailed error messages.
- Unit testing to catch errors early in the development process.
Incorporating these tools into your workflow can improve the efficiency and accuracy of your debugging process.
Conclusion:
Tracebacks are a powerful tool for debugging Python code. By understanding how to interpret and use them, you can quickly identify and fix errors in your code, leading to more robust and reliable software. Always use try-except blocks for graceful error handling and leverage Python’s traceback module for advanced debugging.
Mastering Python tracebacks for debugging will help you resolve coding issues efficiently. Becoming proficient at reading and utilizing tracebacks will make you a debugging expert. Explore more resources and keep learning – happy coding!!