This A to Z guide for Saiku Analytics will walk you through how to use Saiku effectively. Saiku Analytics empowers organizations by offering powerful, web-based analytics that can change the way you make business decisions. Quickly and easily analyze data from any source to discover insights about what is truly happening inside and outside your organization.
Introduction
Background of Saiku
Saiku was founded in 2008 by Tom Barber and Paul Stoellberger. Initially known as the Pentaho Analysis Tool, Saiku has evolved over the years. After a complete rewrite in 2010, it was reborn as Saiku Analytics.
Saiku allows business users to explore complex data using a drag-and-drop interface and business terminology that is easy to understand—all within a browser. With Saiku, you can select your data of interest, view it from various perspectives, and drill into the details.
Once you have the insights you need, you can easily save, share, or export your results to Excel or PDF, all directly from the browser. Saiku connects to a wide range of data sources, enabling real-time exploration of data straight from the source.
Saiku is a modular analytics suite offering lightweight OLAP (Online Analytical Processing). It is easily embeddable, extendable, and configurable. The solution supports multiple OLAP servers and can be deployed rapidly and cost-effectively, allowing users to explore data in real-time. The content provided here is based on the Saiku Community Edition version 3.8.8.
Different Saiku Analytics versions available in the market.
1. Saiku Enterprise Edition(Standalone Server)-This version is chargeable, with a per-user, per-year pricing model.
2. Saiku Community Edition-Saiku is freely available to download from this link .
3. Saiku Enterprise Edition(Pentaho BI Plugin)-Similar to the standalone server edition but with fewer features.
OLAP Analysis
OLAP (Online Analytical Processing) systems help analyze stored data, making them widely used in Data Mining. These systems provide multi-dimensional data analysis and store data in a multi-dimensional schema.
OLAP Operations
1.Slice : This operation selects a single dimension from a data cube to create a sub-cube, reducing the dimensionality of the cube.
2.Dice : This operation selects two or more dimensions from a cube to create a new sub-cube, reducing the number of member values.
3.Drill Up(Roll up) : Aggregates data by moving up a concept hierarchy, thus decreasing the granularity of data.
4.Drill Down(Roll down) : Navigates from less detailed data to more detailed data, thereby increasing data granularity.
5.Pivot : Rotates data axes to view the data from different perspectives.
To learn more about OLAP operations with visual explanations, Click here.
Open Source Advantage
Saiku’s open-source nature offers full customization of its user interface. The interface is built with HTML, JavaScript, and CSS, which makes it easy to modify or replace according to your needs. You can download the the Saiku zip file here.
Features of Saiku Analytics
- Drag & Drop Report-Design.
- Export to: PDF,CSV,XLS.
- Grouping.
- Aggregation.
- Open Formula Support
Installation guide
Requirements:
- Less than 1 GB of RAM
- A computer running Java
Installation Steps:
- Ensure that JDK 7 is installed and JAVA_HOME is set in your environment variables.
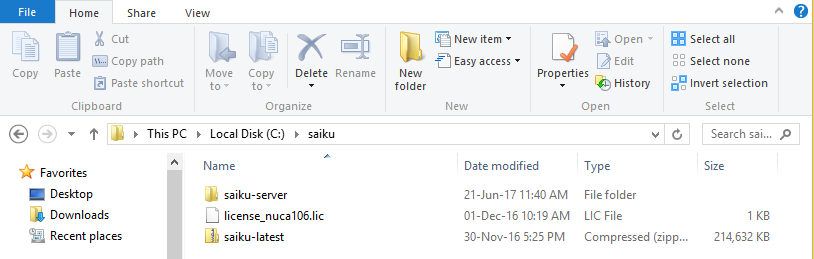
- Download the Saiku zip file here and unzip it to your preferred location.
Below figure show the downloaded zip file along with unzipping file.
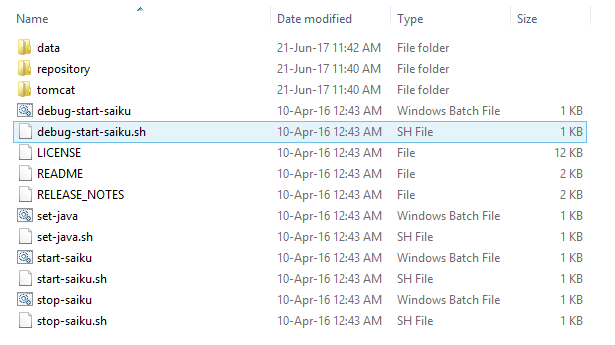
- Open a command prompt or terminal, navigate to the unzipped Saiku folder, and execute either start-saiku.sh (for Linux/macOS) or start-saiku.bat (for Windows).
Once the setup is complete, open your browser and navigate to:
Http://<server-name-or-ip>:8080/
The Saiku login page should now appear.
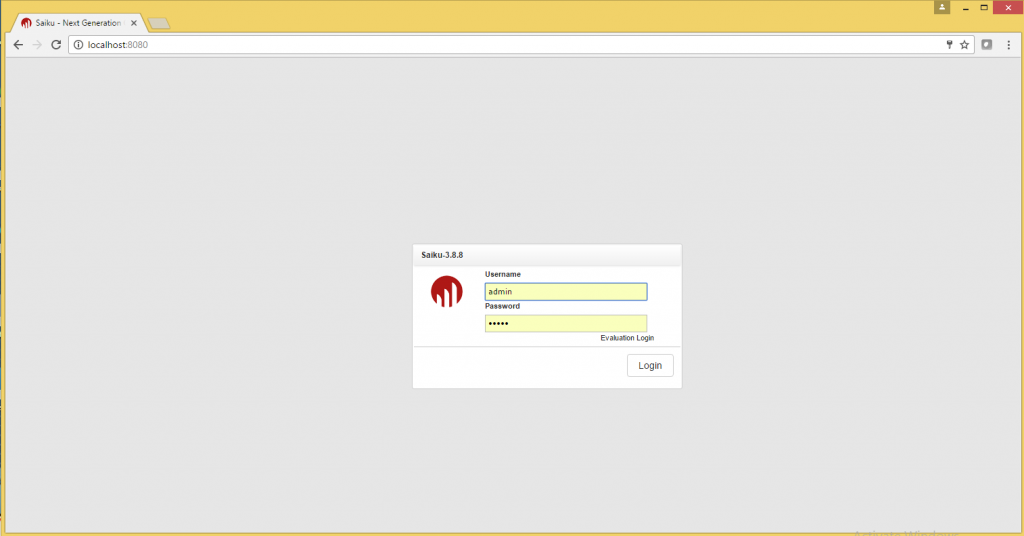
Login:
To log into Saiku, you will need a free license. You can get one from here.
Troubleshooting:
If you encounter issues:
- Ensure port 8080 isn’t blocked or being used by another app.
- Check the JAVA_HOME environment variable.
- Verify you are using JDK 7.
Deploying Saiku
Deploy Saiku by placing the Saiku XML file in the webapps folder of your Tomcat server.
Logging
By default, Saiku logs are stored in the Saiku-server/tomcat/logs folder. Files such as catalina.out and saiku.log provide valuable information for debugging or monitoring the server.
If the saiku.log file is missing, follow these steps to enable it:
Step 1. Enable SQL logging in the log4j.xml file located in saiku-server/tomcat/webapps/saiku/WEB-INF/classes.
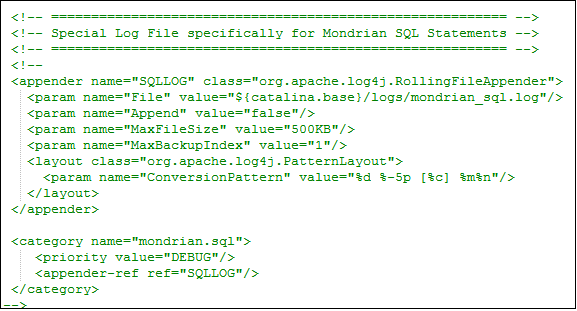
Step 2. Restart the server after making any configuration changes.
Mondrian Schema
In Saiku, schemas are defined by XML documents. A schema contains one or more cubes, which may include shared dimensions, named sets, roles, measures, and user-defined functions.
The root element of a schema is the <Schema> element, which includes the following attributes:
- name: Defines the name of the schema.
- metamodelVersion: Specifies the schema version intended for Mondrian.
The structure of the XML document is as follows:
<Schema>
    <PhysicalSchema>
        <Table>
            <Key>
                <Column />
            </Key>
        </Table>
        <Link>
            <ForeignKey>
                <Column/>
            </ForeignKey>
        </Link>
        <Dimension>
            <InlineTable>
                <ColumnDefs>
                    <ColumnDef></ColumnDef>
                </ColumnDefs>
                <Rows>
                    <Row>
                        <Value></Value>
                    </Row>
                </Rows>
            </InlineTable>
        </Dimension>
    </PhysicalSchema>
    <Cube>
        <Dimensions>
            <Dimension>
                <Attributes>
                    <Attribute></Attribute>
                </Attributes>
                <Hierarchies>
                    <Hierarchy>
                        <Level></Level>
                    </Hierarchy>
                </Hierarchies>
            </Dimension>
        </Dimensions>
        <MeasureGroups>
            <MeasureGroup>
                <Measures></Measures>
                <DimensionLinks>
                    <ForeignKeyLink></ForeignKeyLink>
                    <FactLink></FactLink>
                </DimensionLinks>
            </MeasureGroup>
            <MeasureGroup>(when aggregation is used)

                <Measures></Measures>
                <MeasureRef></MeasureRef>
                <DimensionLinks>
                    <ForeignKeyLink></ForeignKeyLink>
                    <NoLink></NoLink>
                </DimensionLinks>
            </MeasureGroup>(end of aggregation)

        </MeasureGroups>
    </Cube>
</Schema>
Above schema is of Mondrian version 4.x.The order of XML elements is not important in Mondrian version 4.x.This is basic schema structure, you can be used more element as per your schema design.
Schema element
The <Schema> element is the root element of every Mondrian schema.
For example:
<Schema name=”Sales Analysis” metamodelVersion=”4.0″>
A schema has an attribute called name and meta model Verison attribute.
name-Attributes used to define the name of the schema.
metamodel Verison-Used to tell Mondrian, which version the schema intended for.
Administrators Console
The Administration Console allows you to manage users, data sources, schemas, and licenses. Administrators (with the default ROLE_ADMIN) can access the console by clicking the (A) icon in the main toolbar.
The Admin Console includes sections for:
- User Management (Adding, Editing, or Removing Users)
- Data Source Management
- Schema Management
Getting started with Saiku
This guide provides an overview of Saiku, covering installation and configuration. For more in-depth tutorials, explore additional articles about Saiku’s features and functionalities.
Conclusion
This guide covers everything you need to get started with Saiku Analytics, from installation to configuration. Whether you’re exploring OLAP analysis or managing data sources, Saiku is a powerful tool for streamlining your data analytics workflow.